Three Dashboard widgets to display the status of your cluster.
These widgets query Pooch for status data of the Mac cluster, processes it, and then displays the data in the Dashboard.
They require OS X 10.4 or later and
Pooch v1.6 or later.
Below you may download zip archives of these Dashboard widgets.
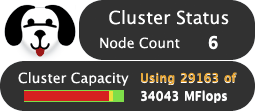
This widget shows the current number of active nodes on the cluster,
and estimates how much computing power (in millions of floating-point operations per second)
that the Mac cluster is capable of.
If some of the nodes are in use for a parallel computing job,
that used capacity is displayed in red in a bar graph.
The yellow indicates the partial load of the remaining nodes.
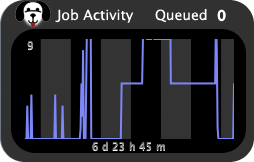
This widget uses Pooch's job data to display how many
jobs are queued and the history of recently launched jobs.
Past jobs are displayed in a graph, usually spanning days of data
and delinated by day, showing how many
nodes were involved in parallel computing from moment to moment.
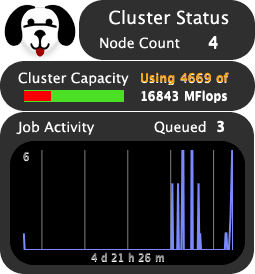
This widget combines the above node and job widgets into one.
The upper half provides the data shown in the Node Scan widget,
while the lower half shows the job data from the Job Scan widget.